Whether Garlic, Strawberry or Avocado: Leading AI companies noticeably often use names from the food world for secret projects. These are the most unusual code names from OpenAI, Google, Meta and Co.

From “Jalapeño” to “Garlic” to “Nano Banana”: What sounds like a stroll through the fruit and vegetable department in the supermarket are sometimes secret names at leading AI companies. These were the most imaginative code names for AI models and projects.
OpenAI, Meta and Google have all relied on names from the world of food for their partly secret plans for future AI models. OpenAI even names a highly anticipated advanced chip after a chili pepper.
Thinking with your stomach is nothing new for Silicon Valley – just think of the selection of desserts Android has put together over the years before Google got tired of them.
This is the AI fruit basket
Here’s a rundown of the delicious-sounding and just plain silly names AI and tech companies use.
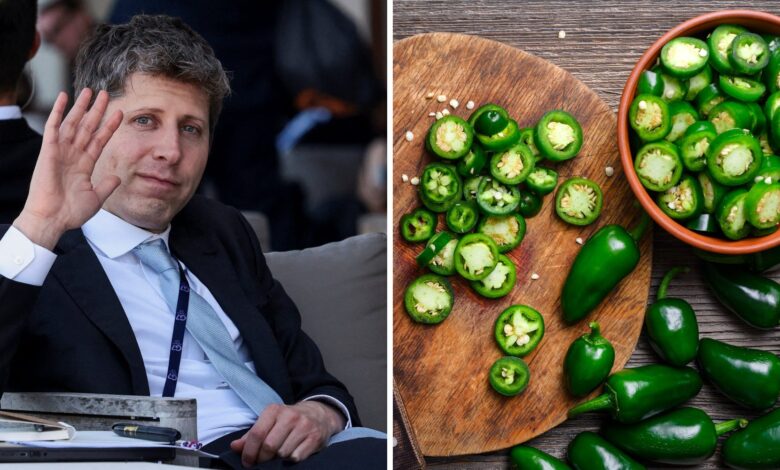
OpenAI: Jalapeno
When you challenge Nvidia, things are bound to get spicy: On June 24, OpenAI announced that the first cutting-edge chip it co-developed with Broadcom is called “Jalapeño.”
“Chips are the foundation of the AI economy,” OpenAI said in a statement. “Developing our own chips expands our full-stack platform from products to models to infrastructure and will help us scale intelligence, reach more people and expand access to AI.”
Garlic
According to reports from The Information platform, the developer of ChatGPT has given his new large language model the code name “Garlic”. Garlic is an independent project and different from another LLM that OpenAI is currently developing under the code name “Shallotpeat”.
Read too

Google: Nano Banana
Google seems to have liked a codename so much that it made it public. Google’s AI image generator in Gemini is called “Nano Banana Pro” and was released on November 20, 2025. Google had previously called the model “Nano-Banana” internally, but did not publicly announce this bizarre choice.
Meta: avocado
According to a report by CNBC, Meta codenamed its pioneering AI model “Avocado.” However, CEO Mark Zuckerberg didn’t stay on the topic of food. Meta SuperIntelligence Labs called the publicly released model “Muse Spark”.
“Muse Spark” was the first model released by Meta since the social media giant invested billions to revamp its AI strategy — including a $14 billion investment in Scale AI to bring in its co-founder Alexandr Wang to lead the business.
Cute, dangerous or artistic – founders get creative with project names
OpenAI may have one of the best codenames of all time, “Strawberry,” which the company used for its o1 model. The name was likely a pun on the much-discussed difficulties of AI models in correctly identifying the number of R letters in the fruit name. Before Strawberry, OpenAI had a shrouded in mystery project called Q*.
Read too

In 2025, Elon Musks had a taste for sweets when an early test version of Grok-3 was codenamed “chocolate”.
Mistral AI, the France-based startup, took a completely opposite animalistic direction with “Jaguar” – the code name for a test model.
And Anthropic called its family of models “Opus,” “Sonnett,” and “Haiku” — a trio of three different types of compositions from music and poetry.